

Money plays a crucial role in every modern economic system, and its symbolic power is correspondingly strong. Coins and banknotes are excellent tools for representing numbers and facts in many different contexts, as money and finance are essential in virtually all professions and businesses.
Coin charts are particularly well-suited as a design element in presentations about banks, the stock market, or finance in general, but also for content related to a company's accounting and bookkeeping. Motifs of cash and balance sheets are equally appropriate for business presentations as they are for illustrating sales, profits, income and expenses, or taxes.
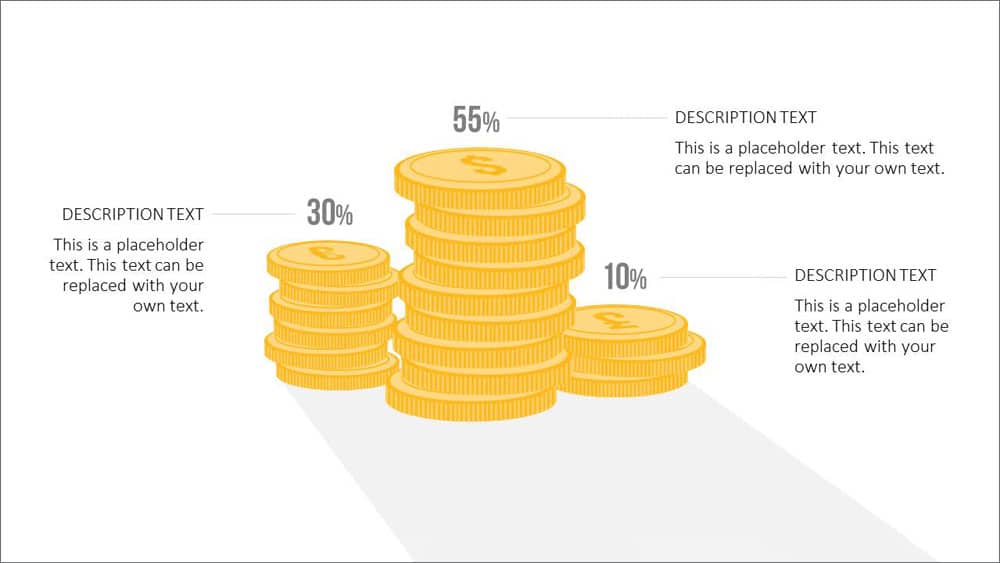
Here, it makes sense to replace conventional charts with coin columns, as the coin-based visualization offers an appealing alternative to the often dry diagrams. Furthermore, they serve as an eye-catcher for your audience, who will be much more likely to pay attention to the interesting and unusual charts.
There are several ways to use coin charts in presentations:
- Financial developments, for example, can be effectively illustrated by combining piles of coins of varying heights with arrows.

- Coins function as powerful symbols in the realm of money and finance. Their audience immediately associates the image of a coin with specific topics. Thus, the use of coins instantly makes it clear that the subject matter now revolves around finance, costs, revenues, or related topics.

- Presentations often overwhelm audiences with a flood of charts and tables and are burdened with confusing numbers. Coin charts tend to stand out from the rest and convey the core message simply and clearly.
How to easily implement coin charts in PowerPoint
The coins for the columns and arrangements described above can be found in our PresentationLoad shop and at Charteo:
Financial Concepts PowerPoint template in flat design
Template: Hand stacking coins into towers of varying heights
Template: Uneven stack of fifteen British pound sterling coins

- The images can be copied and moved as needed.
- First, select the coins and insert them into PowerPoint.
- Arrange the coins as desired and, if necessary, change the height and size of the graphics.
- To align the coin stacks, select all the coins and, under the Drawing Tools > Format menu, choose the Align sub-item. You can now align the stack left , right, or vertically .
Optionally, you can also illustrate financial cycles with coins. Lines and arrows can be used to depict relationships, with different line thicknesses, for example, illustrating varying levels of financial flow. Coin pictograms are also very well suited here to graphically support the content and make it more visually appealing.
Curves over the stacks can also be easily drawn:
- On the Home tab , select a curve from the Shapes tab.
- Simply click on the point in the image where you want the curve to begin.
- Now the curve can be moved as desired with the mouse, and at each point where the curve is to be added, you only need to click again.
- When the curve is finished, end the drawing with a double-click.