

These topics were covered extensively in the first part :
PART 1
1) Basic functions of grouping
2) Actions within the group
3) Instructions for animating a group
4) Display of groups in the selection menu
In the second episode, you will be informed about these topics:
Part 2
5) SmartArt, diagrams, tables and their groupings
6) Adding an element to a group – without losing the animation
7) Unusual examples from practice
In the third part you will read interesting information about the following topics:
Part 3
8) Visually appealing wording with groups
9) “New” effects through groupings
10) More interesting tips & tricks
5. SmartArt, diagrams, tables and their groupings
Since PowerPoint 2010, it has become increasingly easy to quickly create attractive graphics, charts, and tables. The "Group" feature also plays a significant role here.
A SmartArt graphic is a special type of grouping. If you convert—or ungroup—a SmartArt graphic, you can no longer access it using the SmartArt tools. Once you've converted a SmartArt graphic into individual shapes, you cannot convert those shapes back into a SmartArt graphic.
5.1 Editing General SmartArt

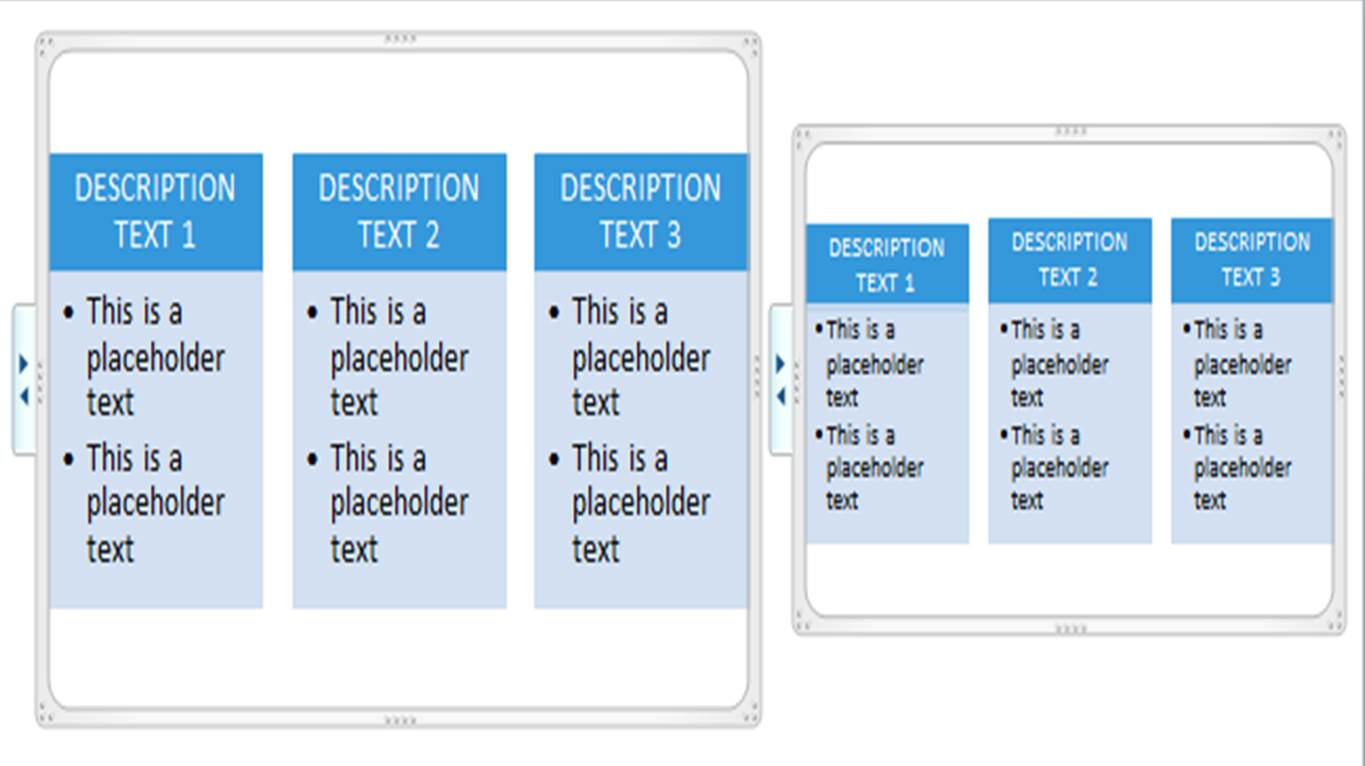
First, insert any SmartArt element via the Insert tab – in this example , "Horizontal Bullets" . The image above shows the SmartArt selection menu as it appears before you actually select the SmartArt element. Below is a demonstration of how the SmartArt element will look on the slide.
If you've used this feature before, you'll know that you can open a tab on the left-hand side, next to the small panel with the two triangles, to enter text. Alternatively, you can enter text directly into the text fields indicated by square brackets.
Similar to a group, you can select, manipulate, rotate, etc., the individual graphics within the SmartArt frame – BUT: you cannot move an individual element (far) beyond the frame.
A) In the lower left text box, only the font color has been changed.
B) Both text boxes were moved up and down, respectively, and rotated. The text was also slightly altered and shortened.
C) The upper text box was moved far to the left and the text color was changed.
D) The lower green text box has been moved as far to the edge as possible. It cannot be moved any further outwards. With grouped text, this is possible almost without limit.

Caution: If you make changes to your SmartArt, but then choose a (new, different) graphic design in the SmartArt Tools at the top of the ribbon, all individual settings will be reset to their respective default values – only the position of the individual objects will remain the same.
E) Here, the example above was re-imprinted using > SmartArt Tools > Design > Change Colors > Accent 2 / Transparent Gradient Area . All text and color areas are then completely adapted to this design.

F) In this variant, the Sunset Scene design was selected for the example using > SmartArt Tools > Design > SmartArt – 3D Styles . All text and color areas are then also adapted to this design and the special 3D representation.

So, you can first use the SmartArt tools to determine the basic design of the entire graphic, and then convert it and process it further as a group.
One of the great advantages of SmartArt is the fact that you can enlarge or reduce the entire graphic and all elements within the SmartArt will change accordingly.
SmartArt is a type of group, meaning you can also ungroup it, i.e., convert it into a group. The process is almost identical to what you're used to:
- Click on the SmartArt graphic.
- Then right-click inside the outer frame. The familiar context menu will open.
- Here, as usual, you select > Group > Ungroup .
- A normal frame appears around all elements, and you can now perform all manipulations on a group (see green text boxes on the right).
- You only need to unpack it one more time and then you will have all the elements of the graphic individually.
- Likewise, you can of course restore all elements to a group using > Grouping.
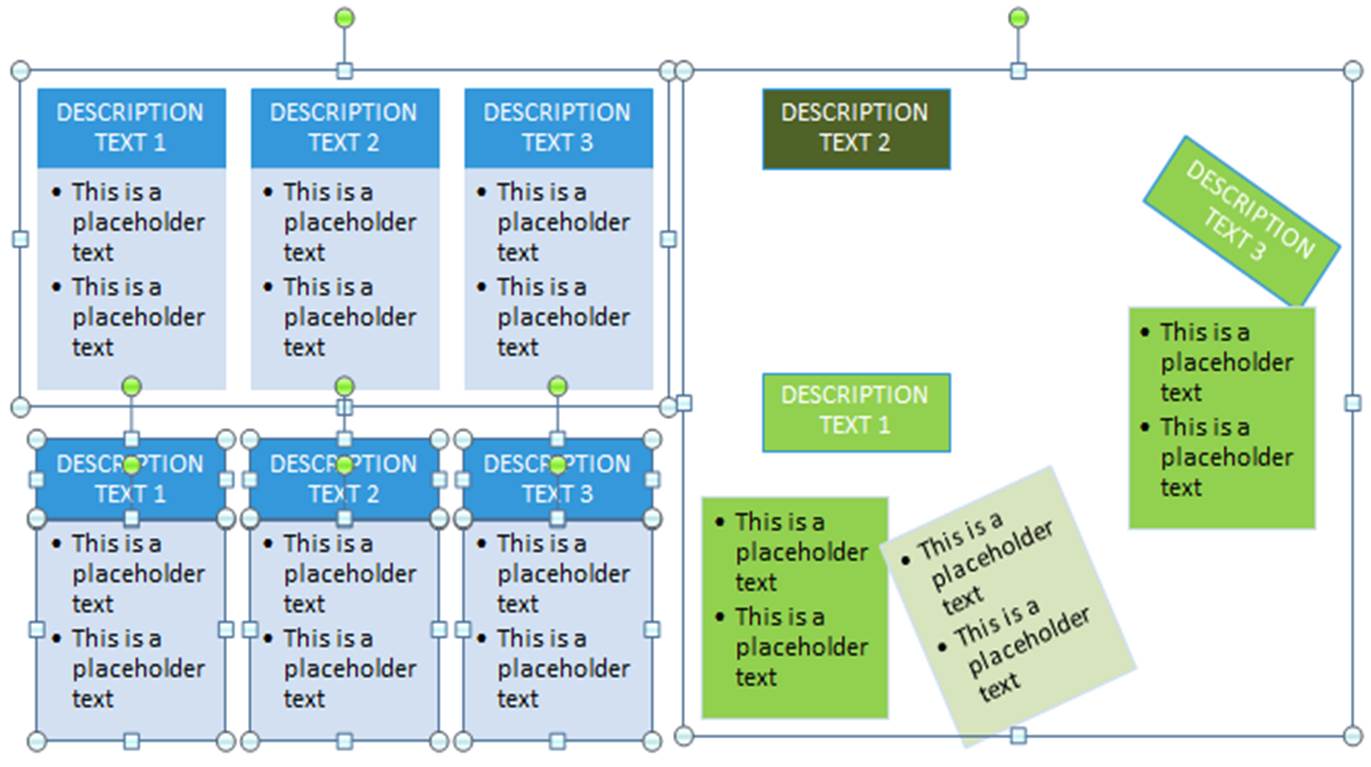
- However, once you have dissolved a SmartArt graphic in this way, there is no way to convert it back into a SmartArt graphic!
5.2 Advantages of creating beautiful SmartArt graphics
With SmartArt, you can quickly create visually appealing graphics and use them as a basis for further actions. This approach is particularly useful in three-dimensional work, as there are many examples of SmartArt available. Creating them from scratch often takes much longer.
An example:
A) A normal text.
B) This text has been converted into a SmartArt graphic.
C) A 3D rendering of this version and then
D) also changed in perspective.
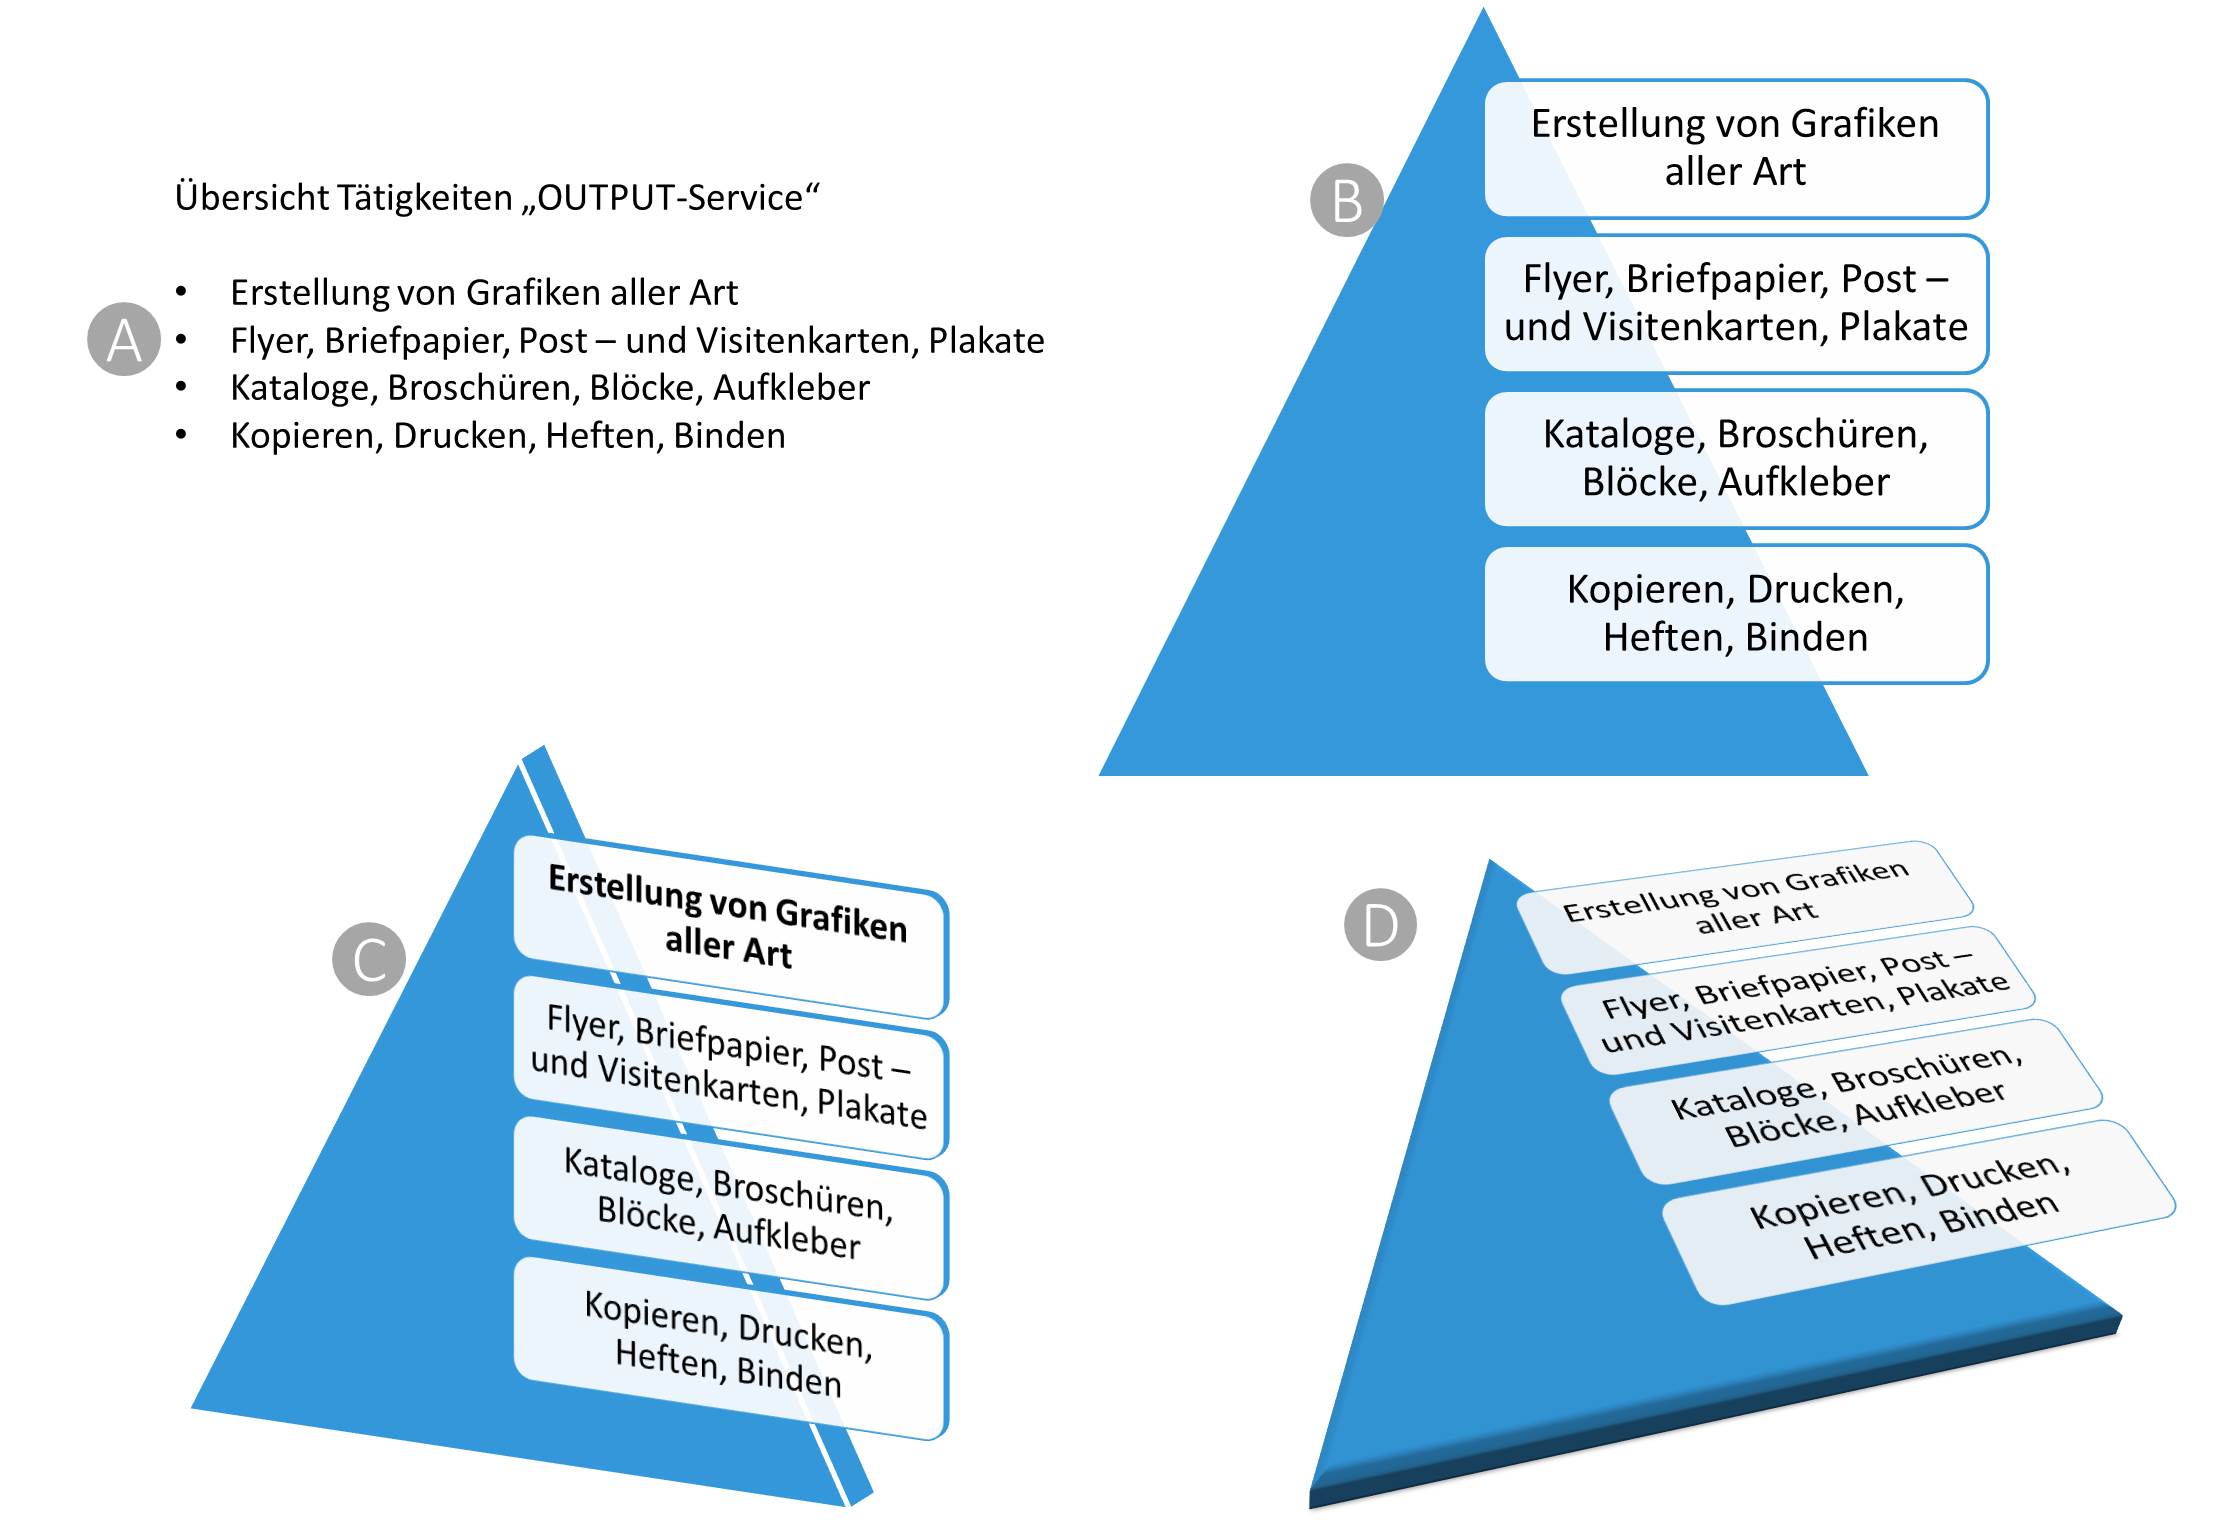
Let's say you find version "C" suitable, but you want to make further changes that don't work within the SmartArt graphic. Then proceed as follows:
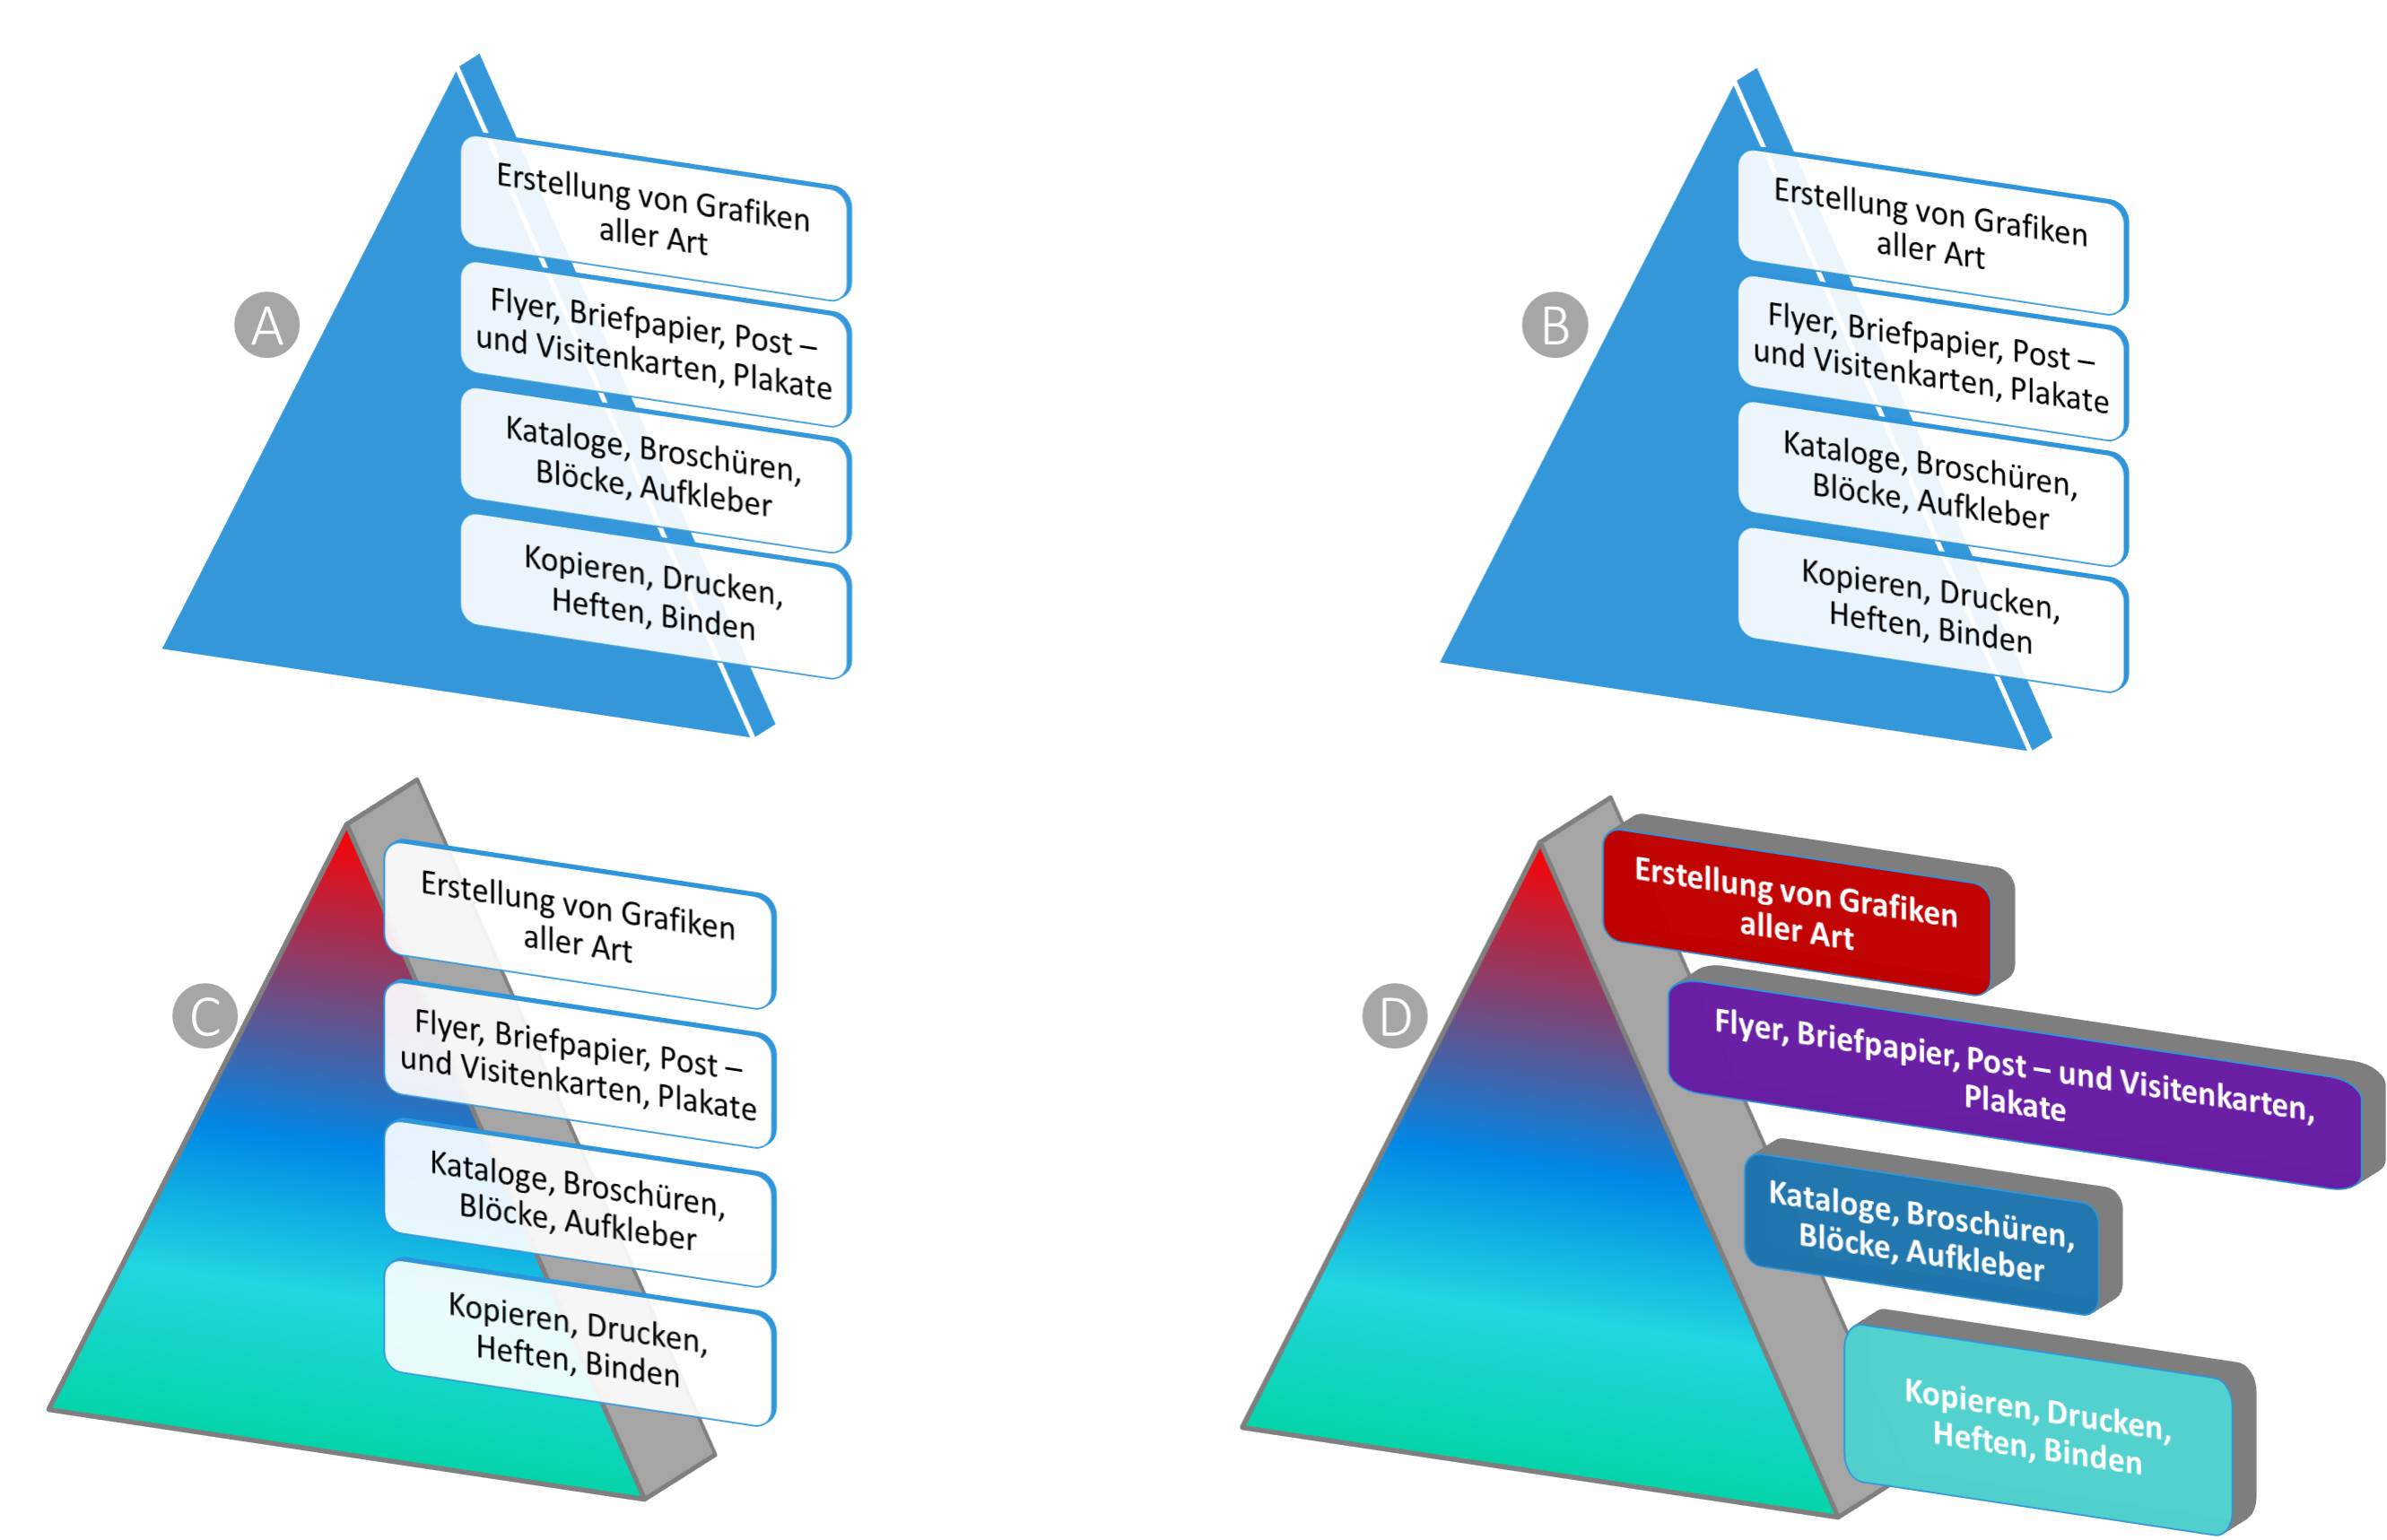
A) The original 3D graphic again.
B) Convert the SmartArt graphic using > SmartArt Tools > Design > Convert > Convert to Shapes and you will now get a group that looks exactly the same.
C) Now you can, for example, change the color fill of the triangle. This would also be possible in principle with the SmartArt graphic, but it's definitely not the next step.
D) Here, the four boxes on the right were individually resized. If they were SmartArt graphics, the text would always be automatically adjusted together, making differentiation impossible.
There are many ways to further process the predefined 3D graphic from SmartArt as a group. The next image shows further visual improvements. The two graphics above (A and B) are SmartArt graphics that illustrate some of the problems with this feature. Below are the solutions as a group.
A) The yellow highlighted box cannot be moved further to the left in SmartArt than shown. In group C) below, there is no such restriction.
B) On the right, in the second box from the top, the text "Office supplies and printer cartridges" (in red) has been added. With SmartArt, the text is automatically resized accordingly AND (!) simultaneously in all other boxes of this SmartArt graphic. In the group shown in C), however, the box can be individually resized, even if, as in this case, the font size also changes.
C) Here you can also see how the left box was placed BEHIND the triangle. With SmartArt, you cannot move the individual text boxes within the layers.
D) This small graphic shows you how the two shapes of the triangle and the upper box must be positioned so that you can use shape subtraction to slightly crop the box on the lower left side. Once this box is transformed back into its 3D appearance, you can also place the boxes very creatively directly on the wide side of the triangle.
E) The top box was positioned accordingly, and all other boxes were created by copying the first box, with only the texts and colors being adopted as before.
The basic 3D shape was created using the SmartArt tools, but the shapes were modified in detail as a group. This allows for easier adjustments later on.

5.3 Grouping SmartArt Graphics
While two or more SmartArt graphics can be grouped, their internal structure remains that of a single SmartArt graphic. Although a common frame is displayed, the group cannot be rotated and can only be moved horizontally or vertically.
A) In the next image, you can see two individual SmartArt graphics at the top.
B) These two have been grouped together below (dashed line).
C) But the two graphics remain as SmartArt.
D) The individual objects within a SmartArt can be edited as usual.

If you change or add text to one of the two displayed graphics, the graphics within the group will still behave like individual SmartArts, i.e., the other text boxes will be resized accordingly.
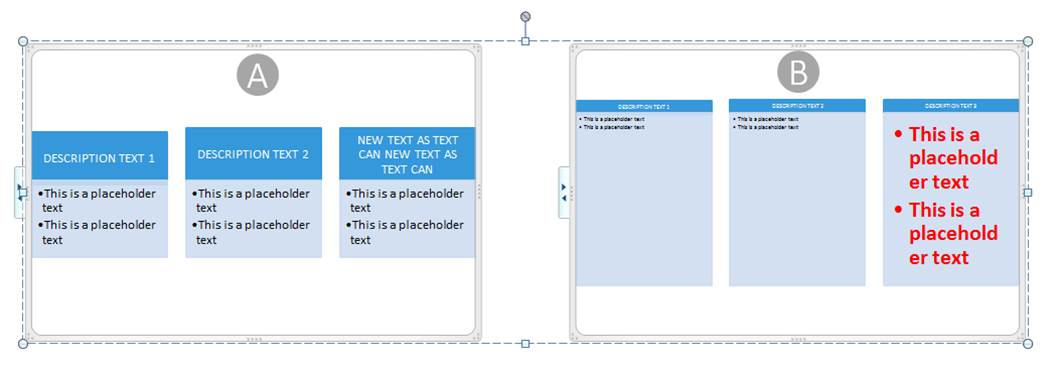
A) Here, the text in the upper right column has been expanded and all fields have been adjusted to the new dimensions.
B) The (red) text on the right was enlarged, and the other two text fields were automatically enlarged accordingly – the other texts were visually reduced in size.
Since even very small changes can have a very strong impact due to the interlocking dependencies, converting them into a group is usually advisable when making adjustments.
5.4 Diagrams and Groupings
In earlier versions of PowerPoint, it was easy to convert a diagram into a graphic and thus obtain all its individual components. From version 2010 onwards, this is only possible via a workaround, and this workaround only works with two-dimensional representations.
- Design a diagram according to your wishes.
- Make all settings (formats, scaling, etc.) - without, however, making any changes to the graphic formatting of the individual points.
- Select the diagram. Copy it to the clipboard.
- Then add it using > Home > Insert > Paste Special > Picture (Extended Metafile, EMF) (The original diagram is on the left, the newly inserted picture is on the right.)

- Then select >Grouping > Ungroup .

- The following query will now appear; answer it with "Yes".

- Then you need to go to >Group > Ungroup a second time.
- Afterwards, all elements of the diagram are marked as individual objects, and you can edit them as usual. Please note that this procedure only works exactly as described here!

- Another advantage is that the possibilities for animations can be used more effectively.
- It's best to think about how you want your graphic to look in the end beforehand. Keep in mind that if you want to create a 3D version of the entire graphic, you'll need to group all the elements so they're handled correctly and consistently. Often, the title or legend can cause problems with perspective settings (see the left side of the next image). It might be better to create these sections separately. Once you've ungrouped the elements, you can move them freely (see the right side of the image).

To achieve planned and controlled results here, one must first familiarize oneself more closely with this "special world" and gain some experience.
5.5 Tables and the group
The procedure for tables is similar to that for diagrams.
A) The original table. It is copied to the clipboard.
B) The table is reinserted via > Start > Insert > Insert Special > Picture (Extended Metafile) .
C) The group will then be ungrouped. After that, you can edit the individual fields separately.
D) However, caution is advised when using 3D representations of these transformed tables, as the individual elements must be moved using the arrow keys, not the mouse. Text editing can also cause problems here.

Especially with tables, you should carefully consider whether you want to abandon the otherwise sufficient table tools. Grouping doesn't offer that many advantages here.
6. Adding an element to a group – without losing the animation
It's not uncommon for users to painstakingly create and animate a group, often with considerable effort. However, later on, a new object needs to be added to the group. Unfortunately, it's not possible to directly insert an object into the group. But there's a workaround to find a solution.
But first, let me point out the "simple" but always feasible way:
If the grouping is relatively simple, the easiest step is to redesign the group with the additional element. Then, under > Animations > Transfer Animation, copy the original animation and delete the old group. However, groups are often very complex, so you might (have to) resort to the second option.
You already learned about the basic procedure in Part 1 of the blog post. Proceed as follows:
A) Here, the first group is shown with three objects (for clarity only, colored areas have been placed behind the other three groups).
B) Within the group, select one or more elements and duplicate them using "CTRL + D". Each element will then exist twice in the group.

C) Move the elements to their respective places (here, to the right, at the same height).
D) Now you are completely free to change the text, colors, or image fill with a different photo.
The group animation will always be maintained!
But what can you do if your group (see image) consists of only two shapes and you want to add additional text fields and insert photos?
The process is essentially described above, but you'll be using a small trick. The viewer cannot visually distinguish between a "real" text box and an edited rectangle if they only see text in the presentation. 
In this case, that means:
A) Within the group, copy the left ellipse. Leave it selected and change its shape to a rectangle (gray) using > Drawing Tools > Change Shape. Duplicate it and replace the fill with a photo from your hard drive.
B) Similarly, copy, for example, the vertically oriented ellipse and change its shape to a rectangle. Then write some text. Afterwards, fill the rectangle with > No Border and > No Fill.
C) Here you can see the finished result. Although you didn't have a text box or photo in the original group, you created these elements using this trick.

The advantages are obvious:
- Faster and easier action
- Later corrections are also possible at any time.
- Minor adjustments to individual objects are possible at any time – without dissolving the group.
- AND: The animation chosen for the group remains in place.
7. Unusual examples from practice
Groups are often created primarily to combine objects or to modify the characteristics of several objects simultaneously.
However, the knowledge gained from this blog demonstrates that grouping offers tangible advantages, leading to greater effectiveness in further processing and use of the groups. Learn about some examples here.
7.1 Representations from mathematics and chemistry
In the natural sciences, the applications of groupings are very diverse. Here are just two examples.
Creating complex mathematical formulas is quite time-consuming. If you later need to make even a few changes, it can be very difficult to incorporate them precisely. The group can also help with simple graphics.
A) You created this group from individual elements.
B) By clicking on the individual objects, you have changed their values. The overall group, and therefore its size, shape, and animation, remain the same.

C) On the right you can see the highlighted individual elements that form the basis of the group.
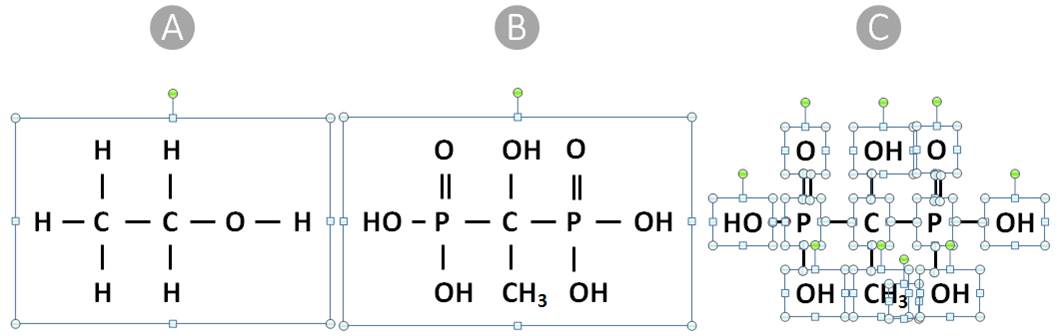
Whether it's chemical formulas or other complex equations – once created, a group can be easily and quickly changed in this way!
The same procedure was followed in the next example.
A) Here you can see the first group created.
B) The second image shows the new/modified group (with more links and text). Remember: You can select an individual element within a group, then duplicate it with Ctrl+D and move it to a suitable location. The new element will automatically be INSIDE the group.
C) Here you can see the individual elements of the group again.
The principle is always the same:
A) You create one or more basic shapes, which you then group together.
B) Copying and moving the elements then modifies this group.
C) On the right you can see the individual objects again.

Ultimately, it is irrelevant what type of graphic it is.
A) The basic form with a total of five elements.
B) Almost 20 elements were quickly copied within the group.
C) On the right you can see all the individual elements again.

7.2 Using groups as basic templates for print media
Due to the many (photo)graphic editing options of PowerPoint, graphics are increasingly being created with it that are used as templates for various printouts, be it as visitor badges, site or room plans for relocation planning, door signs, posters or similar.
Here too, the group serves as a basis and can be easily modified and adapted to new information.
A) On the left is a template that you have created once and can then modify as needed. Depending on the theme, you can design the individual objects.
B) Here, the text was adapted to the (fictional) person, and a photo and a small site plan were inserted. Especially in print media, it is advisable to also use different background colors, e.g., to divide the text by department or similar.
C) Another possible example.

7.3 Building the navigation menu as a group
In self-running presentations or kiosk systems, navigation aids are often offered to help users access specific slides or other documents. These are usually provided by interactive buttons or individual hyperlinks. Another option would be to create a group that you can easily modify and reuse as a basis for other presentations.
The advantage: Interactive buttons that already exist within a group will still work despite the grouping!

An example:
A) Four interactive buttons have been inserted from the shape catalog (at the very bottom of the list of shapes) (top left: previous slide, next to it: next slide, bottom left: first slide of the presentation, next to it: last slide). These four would actually be sufficient as a basis.
B) Now all four have been combined into one group. This group serves as the basis for the next expansions.
C) The base group has now been changed in many ways.
- The top two fields have only been changed in color.
- A new button has appeared on the right. However, when copying the buttons, you'll encounter the problem that the drawing (e.g., the triangle) cannot be modified! With your standard PowerPoint knowledge, you already have the solution: Select one of the two green buttons. Press Ctrl+D to duplicate the button. Move it to the desired location. Now, change the button type via Drawing Tools > Format > Edit Shape > Modify Shape and then " Interactive Button: Customize," essentially selecting an empty field. Next, you need to specify the hyperlink address or, as in this case, a URL. Afterward, you can add an image or a custom fill.
- The two buttons in the bottom left corner have been changed in the same way. Then, a photo was inserted in one of them, and custom text was written into the field on the left.

Especially if you frequently develop presentations for kiosk systems, you can design navigation aids that are perfectly suited to the different applications and topics.
7.4 Use of groups in measurements
When creating a room, relocation, or site plan, dimensions are usually required. Here, too, it's worthwhile to compile several groups as basic models and then adapt them to the specific design requirements.
A) In this series you see the individual elements still ungrouped.
B) The measurements have now become two groups.
C) Further changes were made by simply modifying and copying individual elements within the group. A particular advantage is that you can also drag/enlarge this group to any desired width, ensuring that the elements always remain together within the group. You then only need to adjust any text or other applications to the new conditions of a site plan.
If you frequently work with such plans, it's worthwhile to design a complete construction kit. This would contain the most important basic shapes – possibly already with suitable animations – and when creating a new project, you would only need to refer to your templates and adapt them to the new drawing.

The same applies of course to many other industries, such as electronics, chemistry, architecture, etc.
Have fun and good luck trying it out!