How to change the vertical diagram axis in PowerPoint
You have created a diagram in a PowerPoint document. Now you want to change the vertical axis by allotting new scale values – but don’t know how. With our tutorial we will show you the ropes!
When modeling a diagram, minimum and maximum values will generally appear automatically on the axes according to the data inserted by you for the diagram. However, you may wish the axes to have values much higher than your actual diagram – possibly ranging in millions or billions. In some cases this may completely distort the diagram.
In our 5-step tutorial we will show you how you can change scale values on your vertical axis manually with fixed minimal- and maximal values.
Step 1:
1.1. Create a diagram on a chosen slide via the tab “insert”. Following please click on “illustrations” nested under the “diagram”-tab. An excel table will appear in which you can insert your data. Please close the table afterwards. Now your diagram will show on the marked slide.
1.2. Should you want to insert a prefabricated diagram bought from our PresentationLoad online shop, just open and insert it into your marked slide.
Step 2:
Now please select your diagram by clicking on it with your left mouse button.
Step 3:
Nested under the tab “layout” please click on “diagram layout”.
Step 4:
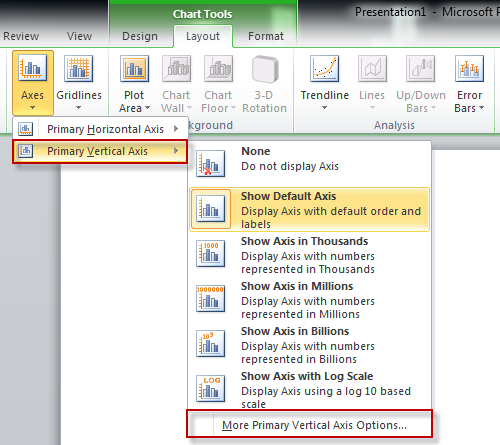
Now please click on “axes” and choose “vertical primary axis” under which you will find the option “more options for the vertical primary axis”.
Step 5:
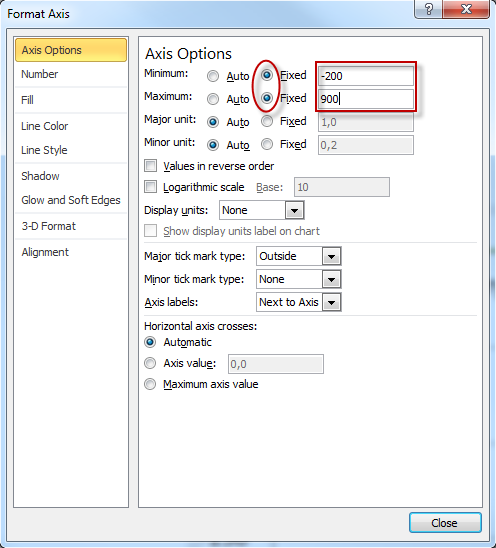
A window for the axis-options will open. Here you can manually insert your desired minimal- and maximum values for the axes. For this please make sure to click on the tab “fixed” in front of the “minimum” and “maximum” insertion fields. Now please close the window.


