Isometric Design

Isometric Design Is Trending: What Does It Mean for Your Presentations?

Isometric design is currently the hottest thing in the design world. This ultra-modern design can be seen on many websites and in PowerPoint presentations. Our world is three-dimensional, so it is not surprising that graphics that appear to have depth are better perceived by Internet users than flat objects. Isometric graphics are simple but 3D….

Using Maps in PowerPoint: The Best Ideas and Tips

Using Maps in PowerPoint: The Best Ideas and Tips

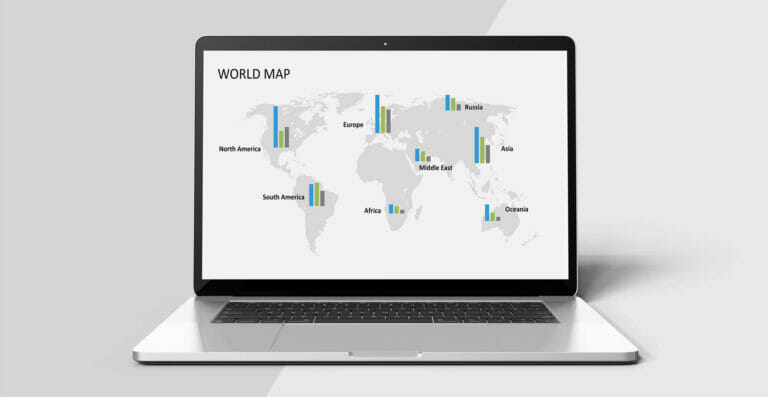
Maps are perfect for displaying locations, sales territories, employee distribution and customers in sales and company presentations. In this article, we’ll take a look at the eight best ideas and tips for using maps in your presentations. With professional map graphics, you can create a variety of charts, diagrams and infographics that are much more…

Graphics: An Interesting and Memorable Way to Present Facts and Figures

Graphics: An Interesting and Memorable Way to Present Facts and Figures

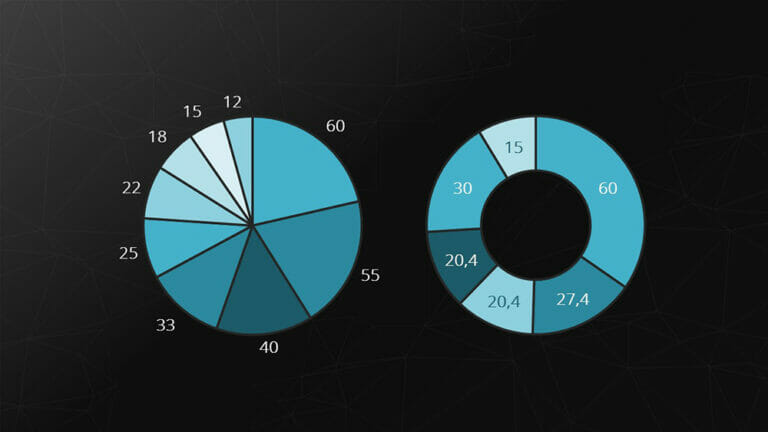
Many presentations include figures such as sales increases, price developments or statistics. If you just read these out, you risk them sliding straight past your audienceโ€™s attention. Since such key figures can be extremely important for the future of the company and influence strategic decisions, it can really help to underline them visually. A Picture…

Optimize Images in Your Presentations

Optimize Images in Your Presentations

Images are an essential part of presentations. Pictures evoke stronger emotions than text alone and help presenters to engage their audience. They are also much more memorable than other content. The correct use of images can make a presentation a huge success.. A professional presentation depends on a thorough review of images and their impact….

Create Professional Layouts with Large Pictures

Create Professional Layouts with Large Pictures

A picture is worth a thousand words. What is used so effectively in advertising can also be applied to your presentations. Large images with minimal text make a lasting impact and transform the entire slide into your very own projection surface. How-To: Customize Transparency and Color Pictures that relate to your presentation topic are more…

Optimize Recurring Report Slides: Save Time Creating Effective and Modern Status Overviews

Optimize Recurring Report Slides: Save Time Creating Effective and Modern Status Overviews

Reports that are repeated in a presentation can quickly become tedious. Presentations full of dry facts and figures that are presented the same way throughout will leave your audience bored and uninspired. Here are a few ideas to save time and give your reports some wow factor: Design an eye-catching mock-up of slides that can…

Original Agenda Slides in Various Designs

Original Agenda Slides in Various Designs

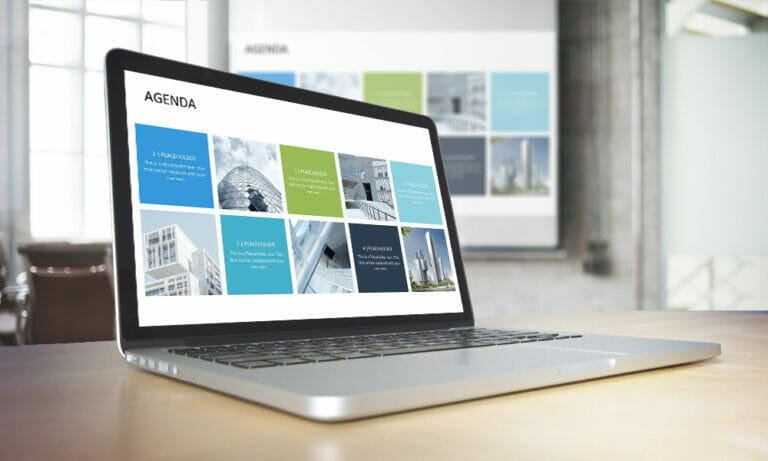
First impressions are important. This also applies to agenda slides at the beginning of your PowerPoint presentation. Use the following techniques to give your presentation that โ€œwowโ€ factor right from the start. Agenda slides are often just plain bullet points outlining the presentation structure.  With the right design and layout, these slides have the potential…

Coin Graphics in PowerPoint

Coin Graphics in PowerPoint

As the saying goes, “Money makes the world go round.” Money plays an essential role in practically all professions and businesses, and its symbolism is powerful. Currency graphics are a great way to present facts and figures in a variety of contexts. Coin graphics offer an attractive alternative to the stuffy, tried-and-true financial graphics. They…

Treemaps in PowerPoint

Treemaps in PowerPoint

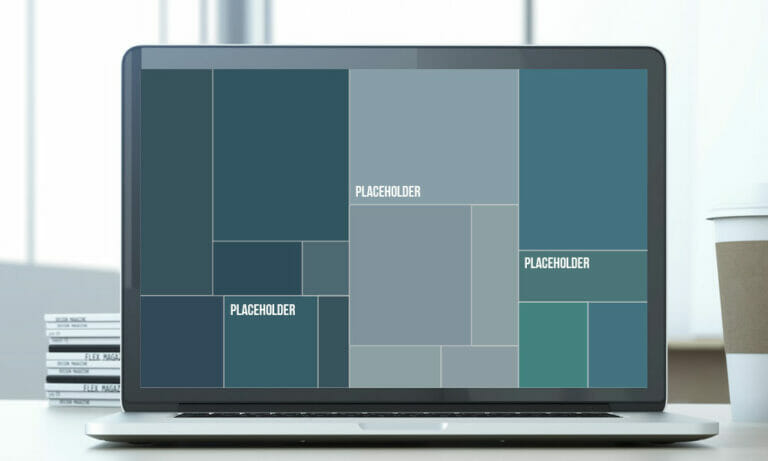
A treemap is a chart of nesting categories ideal for providing a hierarchical view of data, such as your companyโ€™s best-selling products by largest sales. Each color represents a different category. Treemaps offer numerous advantages compared to conventional charts: They make your presentation visuals unique, piquing the interest of your audience. They can be used…